Call us to book free trial and free consultation
Mon - Fri
sales@elitechsystems.com

AWS Certified

We have an in-house AWS certified team of Data Scientists and Data Analyst.

Dedicated Support

Our expert team is available for support in 1300 CST and 0530 IST Timezones.

5+ Years Experience

We are proud to be an early adopters of Data products and tools that are now industry standards.

Custom Frameworks

Our experts has developed in-house data science framework to help speed the turnaround time.

data-visualisation-designmockup

AWS QUickSight Features

Effective Data Visualization Solutions

AWS QuickSight offers a serverless architecture that auto-scales to hundreds of thousands of users with high availability; no need to over-provision for peak usage. The advanced SPICE in-memory engine auto-scales to provide consistent fast response times for end-users and analysts; no need to scale databases for high workloads.

Embed analytics

Easily embed interactive visualizations and dashboards, sophisticated dashboard authoring, or natural language query capabilities in your applications to differentiate user experience and unlock new monetization opportunities.

Analytics with ML insights

Discover hidden insights from your data, perform accurate forecasting and what-if analysis, or add easy-to-understand natural language narratives to dashboards by leveraging AWS’ expertise in machine learning.

QuickSight-Q Advantage

Ask conversational questions of your data and use Q’s ML-powered engine to receive relevant visualizations without the time consuming data preparation from authors and admins.

Pay-per-Session Pricing Model

Get started with no upfront costs or commitments and scale from tens of users to tens of thousands

Data Visualisation Use Cases

Explore sample industry and domain specific analytics built using AWS QuickSight.

AWS Quicksight

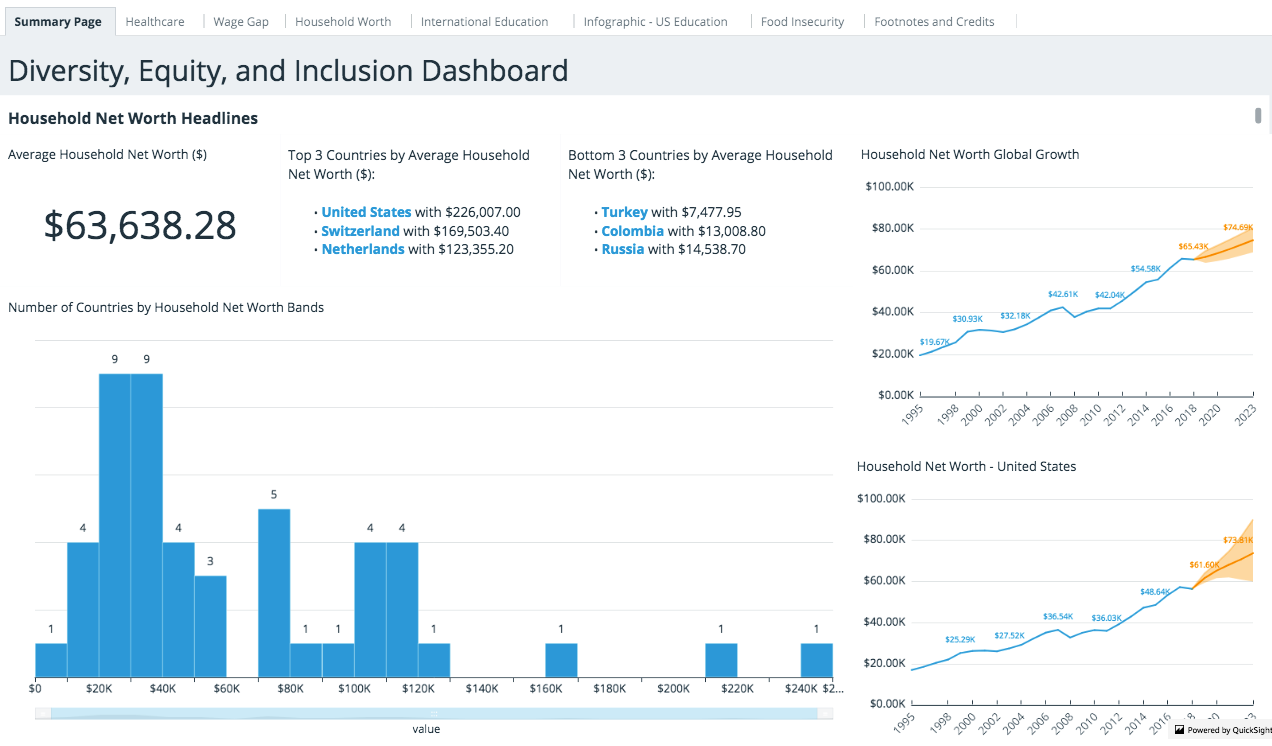
Diversity, Equality and Inclusion

Understand how diversity, education, and inclusion impact healthcare, household worth, food security, and education using data from AWS Data Exchange.
AWS Quicksight

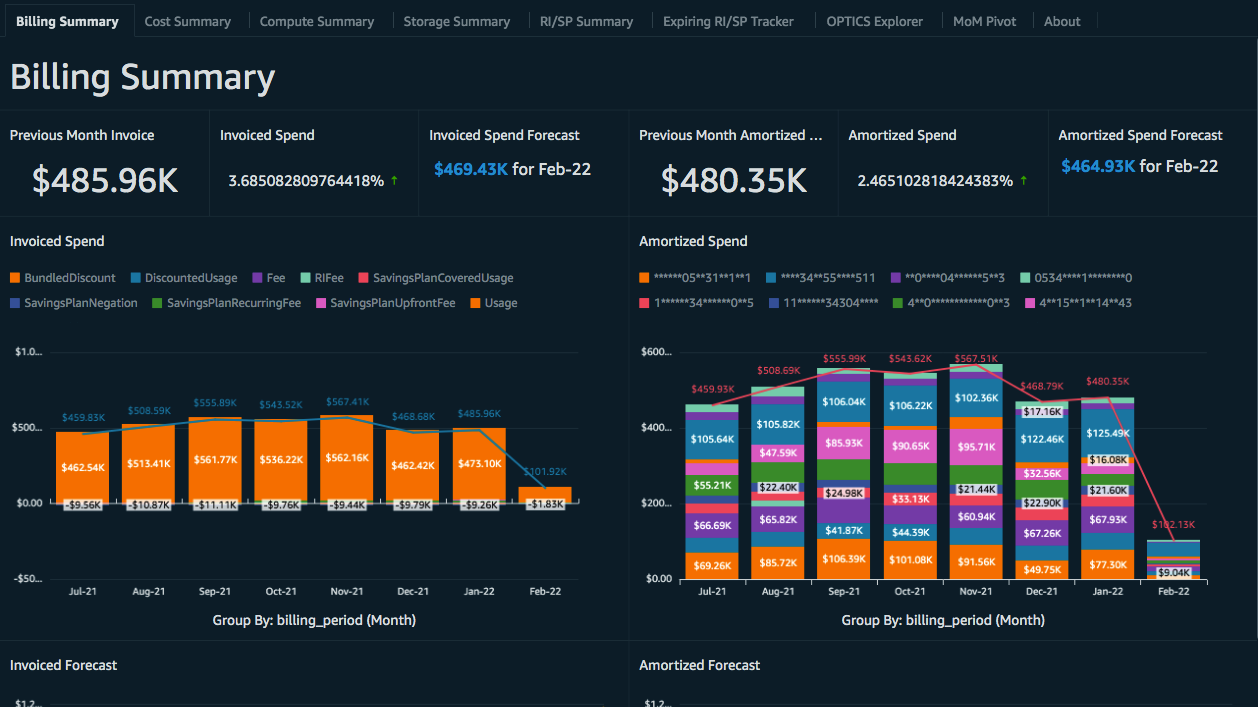
Cost Intelligence Dashboard

Create the foundation of your own AWS cost management and optimization tool with features such as billing summary for chargeback and a single view of benefits from your Reserved Instances and Savings Plans.
AWS Quickstart

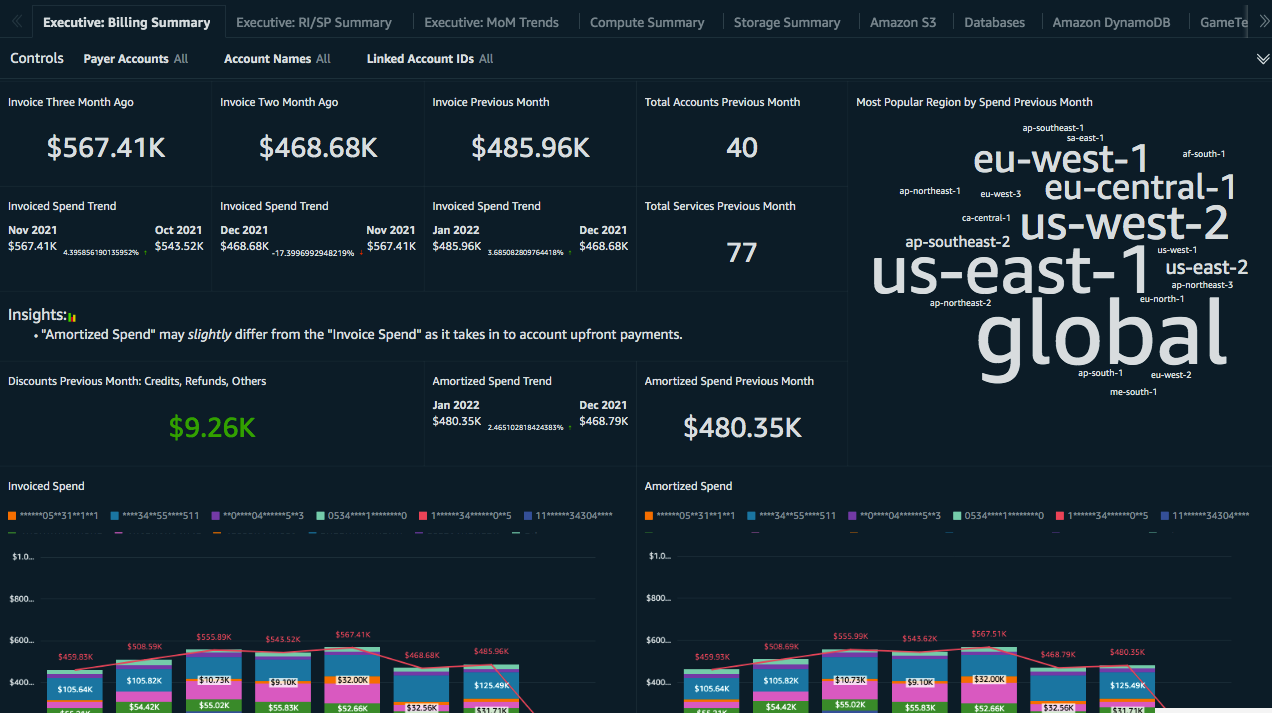
CUDOS

In-depth, granular, and recommendation-driven dashboard to dive deep into AWS cost and usage and to fine-tune efficiency with features such as resource-level granularity and service-level alerts.

Data Visualisation Process Flow

For growing companies, Data visualization is the essential part of the business to make business strategies. Each and every data has its particular need to illustrate data. Listed below are the stages and process flow for Data Visualization.

Acquire

In this step, the entire datasets are obtained or fetched from a variety of sources. The source may be a file or a disk or a networked system. Tables generated after conducting surveys or study reports also constitute datasets to be acquired for data visualization.

Parse

Most often, the raw datasets are unorganized and unstructured which are difficult for analysis and visualization. Therefore, the data needs to be restructured into different categories, which helps better visualize and understand data. Such structuring and organization of data may be done based on tags, indices, and names.

Filter

In this step, the data that is unnecessary concerning the current point of view for analysis and visualization is filtered out. The data to be filtered out may be crucial for the point of view for some other data analysis or visualization; therefore it must not be assumed it is less important.

Mine

The filtered data that needs to be analyzed is now mined by applying various mathematical and statistical formulae upon it. This process converts the filtered data into variables denoting values or quantities that help viewers seek insights that cannot be gained from raw data or statistics.

Represent

One of the biggest challenges is to decide which visualization form is most suitable and represents the right information. The data exploration capability is necessary to statisticians as this reduces the need for duplicated sampling to determine which data is relevant for each model.

Refine

Refining and Improving the visualization for it to be more engaging, captivating, and enriched. To achieve this, various graphic design tools and technologies are used. Online reports, charts, and dashboards usually bank upon technologies such as HTML5, CSS, and SVG for achieving the purpose.

Interact

An essential quality of digital dashboards and charts is interactivity; the user should be able to select varying data ranges, time intervals, and chart forms for analyzing a dashboard according to multiple viewpoints.

Why Choose Elitech?

aws consultion logo

Specialized technology expertise

Customers hire Elitech Systems for highly complex and innovative projects for mainly two reasons. Experienced and super-smart engineers backed by industry-specific blueprints; and a collaborative engineering culture where all team members speak the same language, share the same values, and solve problems together.
data management and visulization

Industries
We Work With,

Select right software partner that can bring your ideas to life.

Each developer at Elitech has an acute understanding of the tremendous benefits a well-executed project can bring to a business in any of the industries we serve. That is why the Elitech team goes to great lengths to develop effective and timeless solutions to help enterprises and government organizations achieve their goals with precision and speed.

agriculture icon

Banking & Finance 

project icon

Construction

goverment icon

e-Governance

online-course icon

Education & e-Learning

ecosystem icon

Energy

Healthcare

restaurant icon

Hospitality

Logistics and Distribution

manufacture icon

Manufacturing

conference icon

Meetings & Events

real-estate icon

Real-Estate

shop icon

Retail & FMCG

We’ve worked for

Some of the amazing Companies

adani logo
novomet-logo
NiBILL
bharatcall logo
SpyGlass appraisal

FAQ

Some of the Most Frequently Asked Questions about AWS QuickSight

QuickSight mobile apps (available on iOS and Android) gives instant access to your data and insights for you to make decisions on the go. Browse, search and interact with your dashboards. Add dashboards to Favorites for quick and easy access. Explore your data with drill downs, filtering and more. You can also use a web browser on any mobile device to access Amazon QuickSight.
Traditional BI solutions often require teams of data engineers to spend months building complex data models before generating a report. They typically lack interactive ad-hoc data exploration and visualization, limiting users to canned reports and pre-selected queries. Traditional BI solutions also require significant up-front investment in complex and costly hardware and software, and then customers to invest in even more infrastructure to maintain fast query performance as database sizes grow. This cost and complexity makes it difficult for companies to enable analytics solutions across their organizations. Amazon QuickSight has been designed to solve these problems by bringing the scale and flexibility of the AWS Cloud to business analytics. Unlike traditional BI or data discovery solutions, getting started with Amazon QuickSight is simple and fast. When you log in, Amazon QuickSight seamlessly discovers your data sources in AWS services such as Amazon Redshift, Amazon RDS, Amazon Athena, and Amazon Simple Storage Service (Amazon S3). You can connect to any of the data sources discovered by Amazon QuickSight and get insights from this data in minutes. You can choose for Amazon QuickSight to keep the data in SPICE up-to-date as the data in the underlying sources change. SPICE supports rich data discovery and business analytics capabilities to help customers derive valuable insights from their data without worrying about provisioning or managing infrastructure. Organizations pay a low monthly fee for each Amazon QuickSight user, eliminating the cost of long-term licenses. With Amazon QuickSight, organizations can deliver rich business analytics functionality to all employees without incurring a huge cost upfront.
Amazon QuickSight is built with “SPICE” – a Super-fast, Parallel, In-memory Calculation Engine. Built from the ground up for the cloud, SPICE uses a combination of columnar storage, in-memory technologies enabled through the latest hardware innovations and machine code generation to run interactive queries on large datasets and get rapid responses. SPICE supports rich calculations to help you derive valuable insights from your analysis without worrying about provisioning or managing infrastructure. Data in SPICE is persisted until it is explicitly deleted by the user. SPICE also automatically replicates data for high availability and enables QuickSight to scale to hundreds of thousands of users who can all simultaneously perform fast interactive analysis across a wide variety of AWS data sources.
Amazon QuickSight supports the latest versions of Mozilla Firefox, Chrome, Safari, Internet Explorer version 10 and above and Edge.
You can connect to AWS data sources including Amazon RDS, Amazon Aurora, Amazon Redshift, Amazon Athena and Amazon S3. You can also upload Excel spreadsheets or flat files (CSV, TSV, CLF, and ELF), connect to on-premises databases like SQL Server, MySQL and PostgreSQL and import data from SaaS applications like Salesforce.
With Amazon QuickSight you don’t need to worry about scale. You can seamlessly grow your data from a few hundred megabytes to many terabytes of data without managing any infrastructure.
You have several options to get your data into Amazon QuickSight: file upload, connect to AWS data sources, connect to external data stores over JDBC/ODBC, or through other API-based data store connectors.
Schedule a meeting