Call us to book free trial and free consultation
Mon - Fri
sales@elitechsystems.com

Certified Experts

We have an in-house certified team of Data Scientists and Data Analyst.

Dedicated Support

Our expert team is available for support in 1300 CST and 0530 IST Timezones.

5+ Years Experience

We are proud to be an early adopters of Data products and tools that are now industry standards.

Custom Frameworks

Our experts has developed in-house data science framework to help speed the turnaround time.

data-visualisation-designmockup

AWS QUickSight Features

Our Tableau expertise to transform your data practices

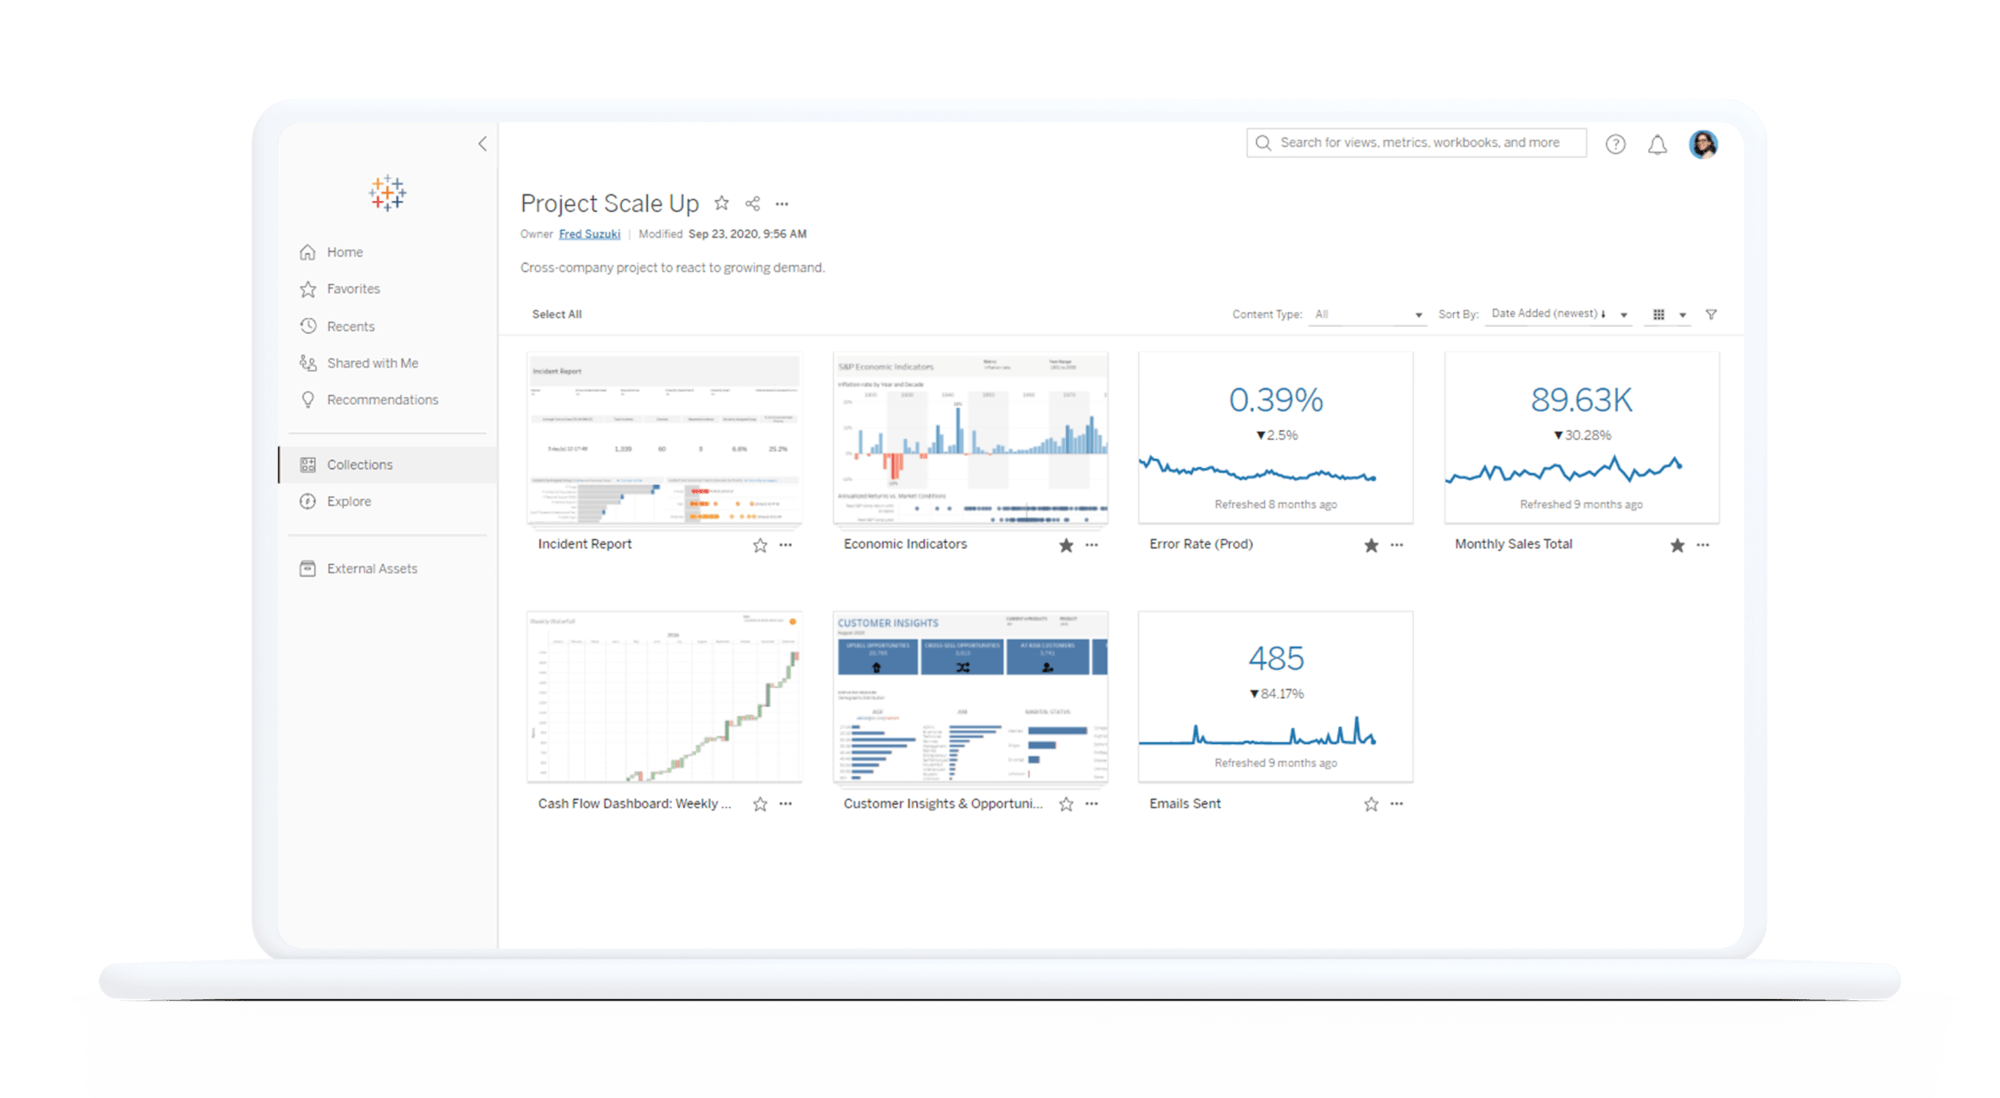
Tableau BI Software comes packed with an array of features to meet all your data related needs.Uneecops as one of the best tableau business intelligence partners can help you build a data-driven culture no matter where you are in your analytics journey.

Data visualization

We assist our clients with data integration by converting raw data into charts and graphs, allowing them to identify trends and patterns and make informed decisions.

Data preparation

We integrate data from disparate data sources, filter the data and make it ready for analytics to generate valuable insights.

Analytics capabilities

Our adept analytical experts help you to make insights-driven decisions in real-time using data integration of right data points and KPIS.

Data management

Our Tableau experts can help you in building your analytics from data preparation to cataloging, search and governance by using the right data.

Data Visualisation Use Cases

Explore sample industry and domain specific analytics built using AWS QuickSight.

sales-commission-model

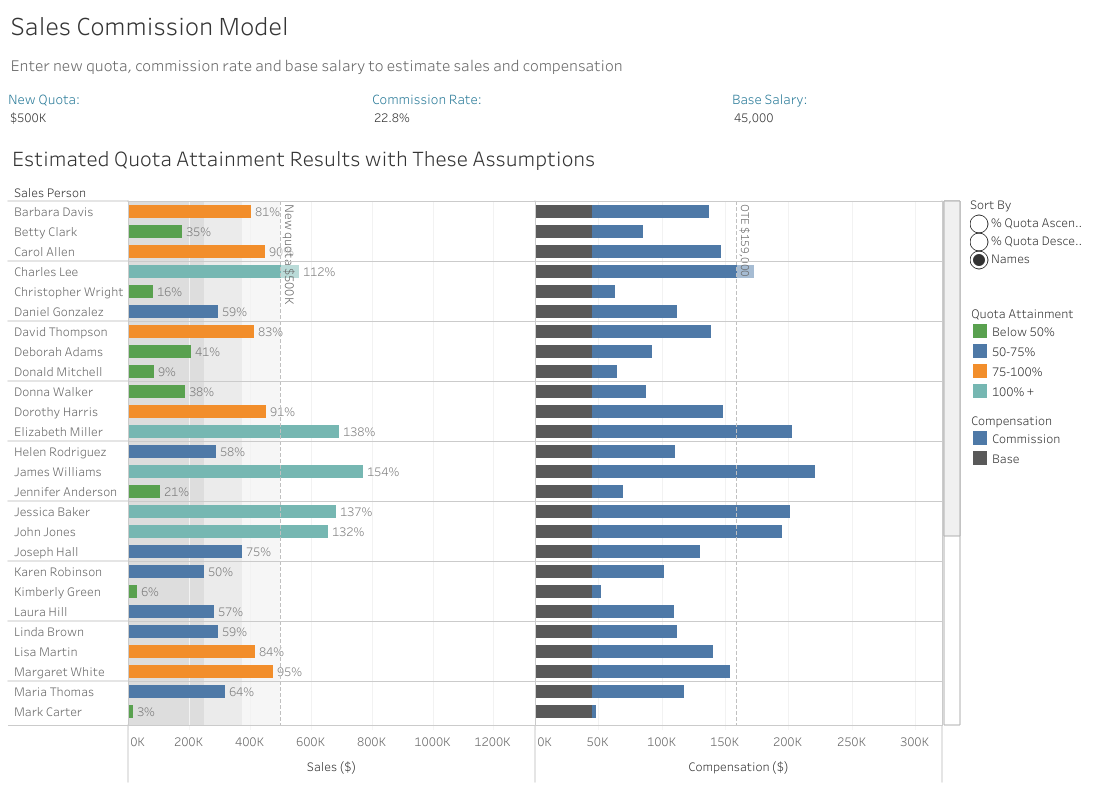
Sales Commission Model

Managing a sales team is a lot easier when you have the right insights at your fingertips. With this visualization, you can quickly explore the relationships between compensation type, commission, and quota attainment for a specific group of salespeople, and see the impact on the company as a whole.
Shipping-kpi

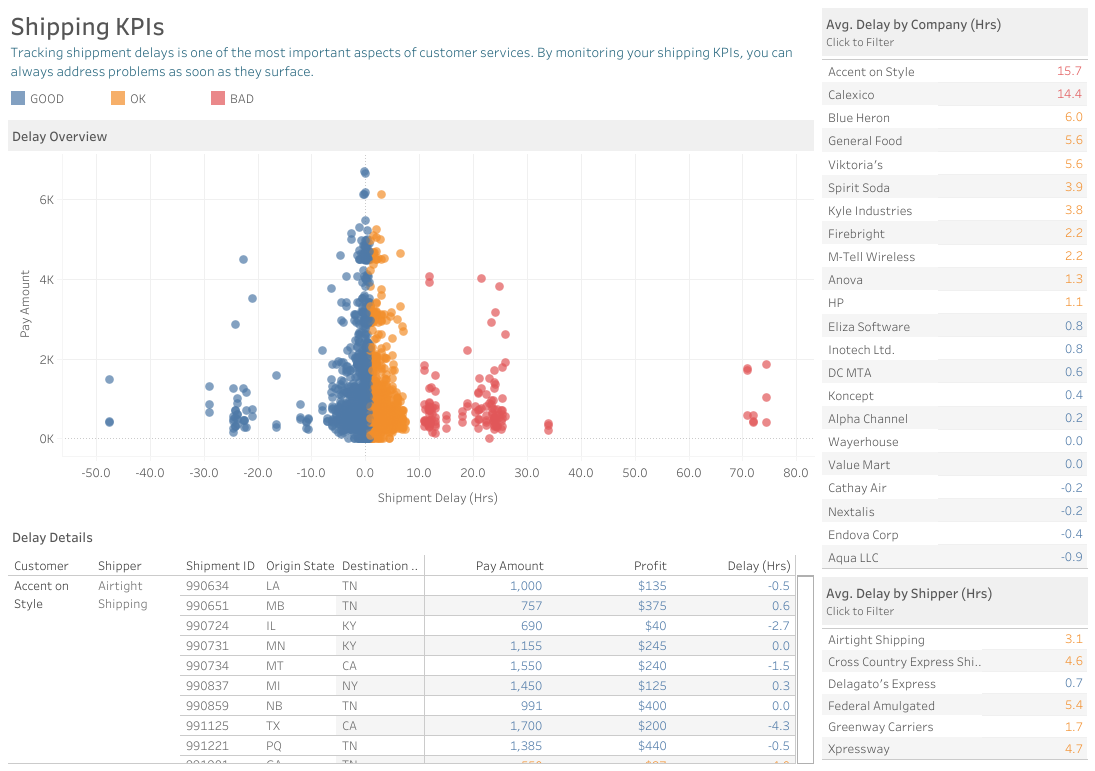
Profitability and Shipping KPIs

Profitability and customer service are two of the most important aspects of business success. This workbook provides two dashboards that track the key performance indicators of profitability and shipping.
Correlatio-dashboard

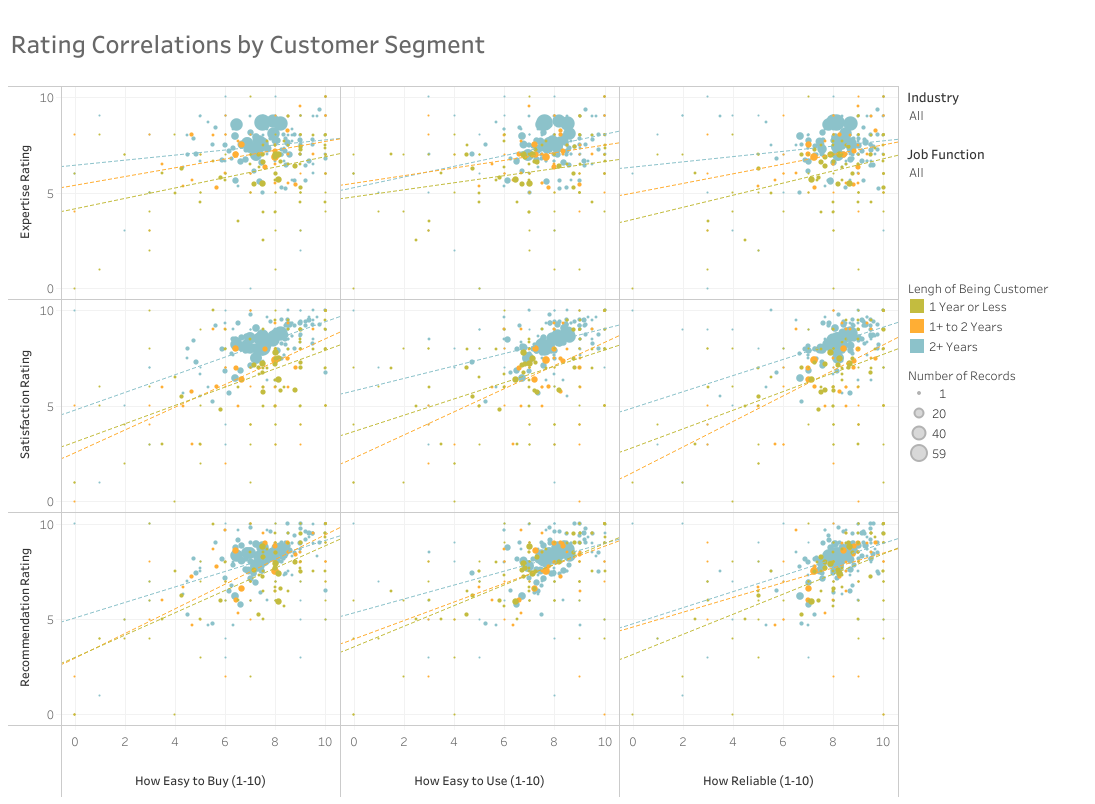
Measuring Customer Satisfaction

Many businesses have survey data somewhere, waiting for better analysis. Using a survey containing ratings from 1 to 10, this analytical view correlates ratings of overall satisfaction, firm expertise, and likelihood to recommend for several customer segments.

Data Visualisation Process Flow

For growing companies, Data visualization is the essential part of the business to make business strategies. Each and every data has its particular need to illustrate data. Listed below are the stages and process flow for Data Visualization.

Acquire

In this step, the entire datasets are obtained or fetched from a variety of sources. The source may be a file or a disk or a networked system. Tables generated after conducting surveys or study reports also constitute datasets to be acquired for data visualization.

Parse

Most often, the raw datasets are unorganized and unstructured which are difficult for analysis and visualization. Therefore, the data needs to be restructured into different categories, which helps better visualize and understand data. Such structuring and organization of data may be done based on tags, indices, and names.

Filter

In this step, the data that is unnecessary concerning the current point of view for analysis and visualization is filtered out. The data to be filtered out may be crucial for the point of view for some other data analysis or visualization; therefore it must not be assumed it is less important.

Mine

The filtered data that needs to be analyzed is now mined by applying various mathematical and statistical formulae upon it. This process converts the filtered data into variables denoting values or quantities that help viewers seek insights that cannot be gained from raw data or statistics.

Represent

One of the biggest challenges is to decide which visualization form is most suitable and represents the right information. The data exploration capability is necessary to statisticians as this reduces the need for duplicated sampling to determine which data is relevant for each model.

Refine

Refining and Improving the visualization for it to be more engaging, captivating, and enriched. To achieve this, various graphic design tools and technologies are used. Online reports, charts, and dashboards usually bank upon technologies such as HTML5, CSS, and SVG for achieving the purpose.

Interact

An essential quality of digital dashboards and charts is interactivity; the user should be able to select varying data ranges, time intervals, and chart forms for analyzing a dashboard according to multiple viewpoints.

Why Choose Elitech?

tableau partner company

Specialized technology expertise

Customers hire Elitech Systems for highly complex and innovative projects for mainly two reasons. Experienced and super-smart engineers backed by industry-specific blueprints; and a collaborative engineering culture where all team members speak the same language, share the same values, and solve problems together.
data management and visulization

Industries
We Work With,

Select right software partner that can bring your ideas to life.

Each developer at Elitech has an acute understanding of the tremendous benefits a well-executed project can bring to a business in any of the industries we serve. That is why the Elitech team goes to great lengths to develop effective and timeless solutions to help enterprises and government organizations achieve their goals with precision and speed.

agriculture icon

Banking & Finance 

project icon

Construction

goverment icon

e-Governance

online-course icon

Education & e-Learning

ecosystem icon

Energy

Healthcare

restaurant icon

Hospitality

Logistics and Distribution

manufacture icon

Manufacturing

conference icon

Meetings & Events

real-estate icon

Real-Estate

shop icon

Retail & FMCG

We’ve worked for

Some of the amazing Companies

adani logo
novomet-logo
NiBILL
bharatcall logo
SpyGlass appraisal

FAQ

Some of the Most Frequently Asked Questions about Tableau Software

Tableau software is a smart and enterprise-ready data visualization tool which is rated by Gartner as a leader for years in a row. Used by leading businesses around the world, it comes packed with an array of features to get actionable insights in real-time. Tableau has beautiful and insightful reports and dashboards with a simple drag and drop interface which makes analysis super easy and interesting.
Tableau software works by connecting and extracting the data stored in various places. It can pull data from any platform. It can extract data from any database, be it Excel, PDF, files, feeds, different business applications & even in-house apps. The data extracted can be connected live to the Tableau data engine and Tableau Desktop. This is where the data analyst can start developing visualizations.

Tableau is a self-service BI software which means you need not have to be technical sound to start using this BI software. The learning curve of Tableau is low and with a little training by Tableau you will be on the way to using this software with no hiccups.

Tableau is designed to make analysis easy. Thanks to its ability to deliver in depth insights in a matter of minutes. Analysis trends with Power BI is super easy while with an excel it is a constant battle. Excel also lacks the predictive forecasting models which are present in Tableau software.

Tableau enables businesses to make actionable decisions anytime and anywhere. It empowers decision makers to make ad-hoc analysis with facts and figures. It is the most versatile and easy-to-use business intelligence tool which helps every business user understand their most valuable asset- data with intuitive dashboards and visualization tools.

 
Schedule a meeting